The National Oceanic and Atmospheric Administration, or NOAA, analyzes weather conditions across the United States every day of every year. Each decade, these conditions such as temperatures, rainfall, snowfall, etc, are used to update climate data.
When looking at climate data, 30-year averages are used to represent the normals. This week, the US climate normals were updated to show the most recent data from 1991-2020. Knowing climate data allows us to wonder, "What will the weather be like in Denver in 5 months?" and to have a basis for an answer. Of course, we can't (yet) accurately predict the weather for a specific day that far in advance, but climate data shows us a general picture of what to expect at any given place at a given time.
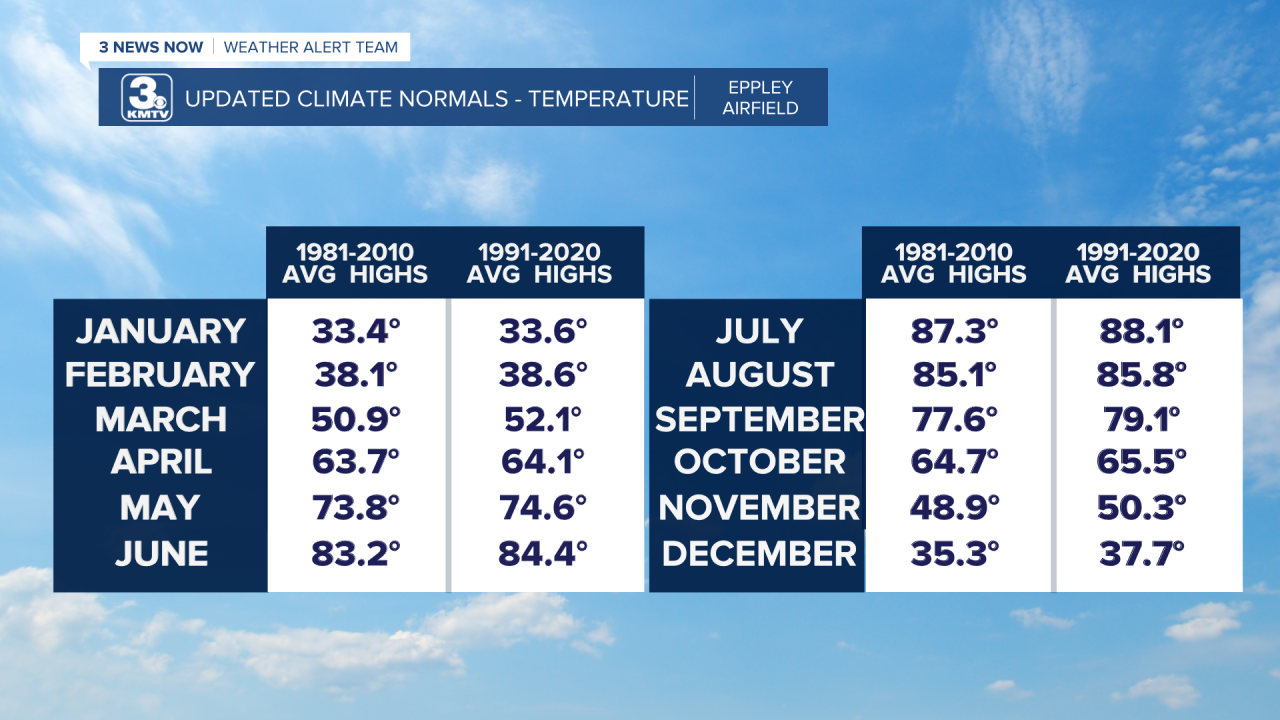
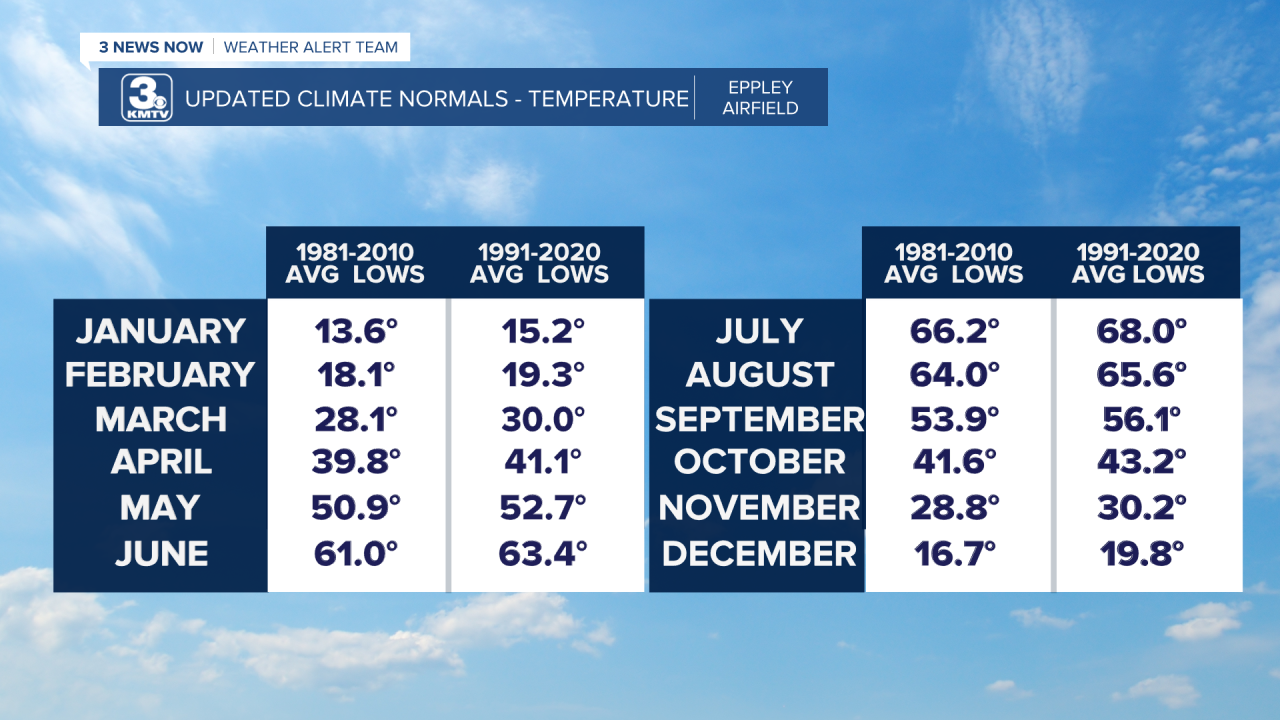
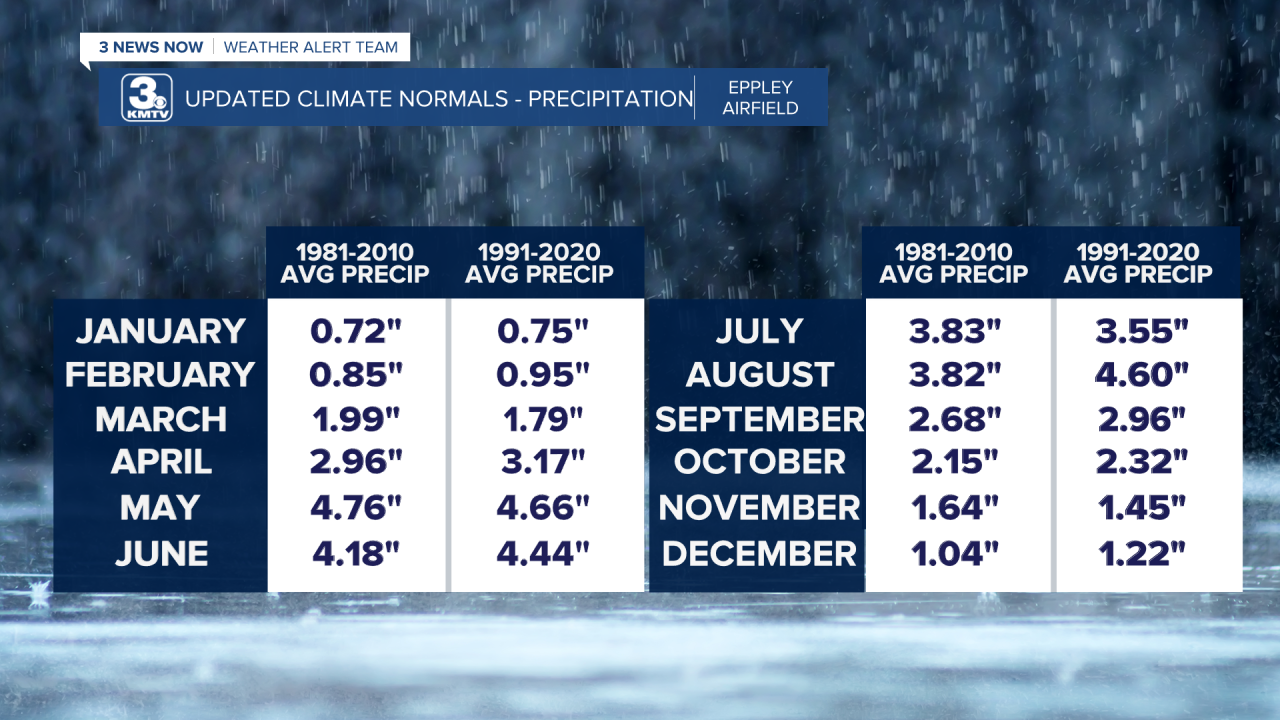
In general, this update shows average highs and lows have both increased over the past decade and we're seeing more precipitation, too. This is not unexpected, given the impacts of global climate change leading to warming temperatures across the planet. When temperatures warm, we generally see more precipitation since more water is evaporated from oceans and then enters the atmosphere.
The following three images show the data in numerical form and then two graphics of the US with the difference shown between the last 30 years to the most recent 30 years with respect to temperature and precipitation.


Below, you can find the numerical data for changes in average snowfall. Overall, our annual snow total has increased from 26.4 inches to 27.1 inches.

