


Since meteorologists began systemically documenting tornadoes in the 1950s, we have gotten significantly better at identifying tornadoes that we would have missed otherwise. Tornadoes that happen in rural areas where no one was around to document them are no longer being missed thanks to technology such as radar or satellite. Nowadays, we believe we capture most tornadoes that touch down.
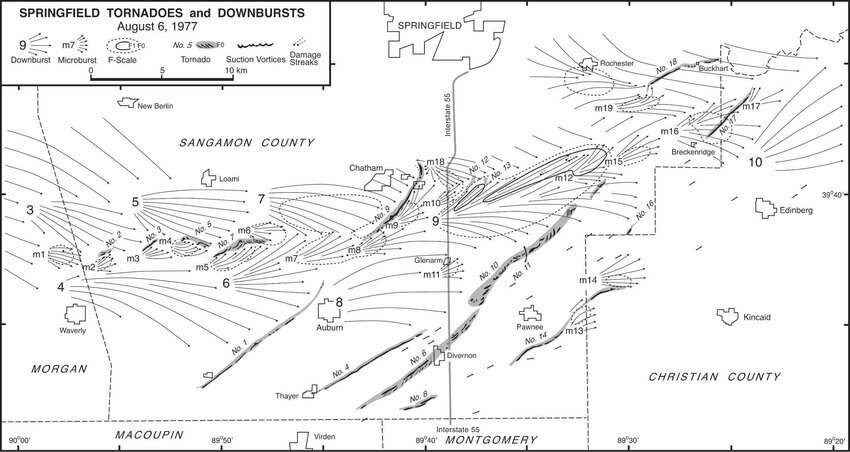
However, there are a few events that make meteorologists scratch their heads and question if we capture every tornado inside storms. On Aug. 6, 1977, a cluster of storms moved near Springfield, Ill., and produced significant straight-line wind damage. However, on later analysis using aerial images, researchers, including Ted Fujita, discovered the storm produced 18 tornadoes alongside major wind damage. This was one of the first events where meteorologists questioned if squall lines produced many more tornadoes than originally thought.
Most recently, the squall line which moved through Nebraska and Iowa on Dec.15, 2021, raised this same question. Upon later analysis, the squall line produced 120 tornadoes, 32 of those being in the KMTV viewing area.

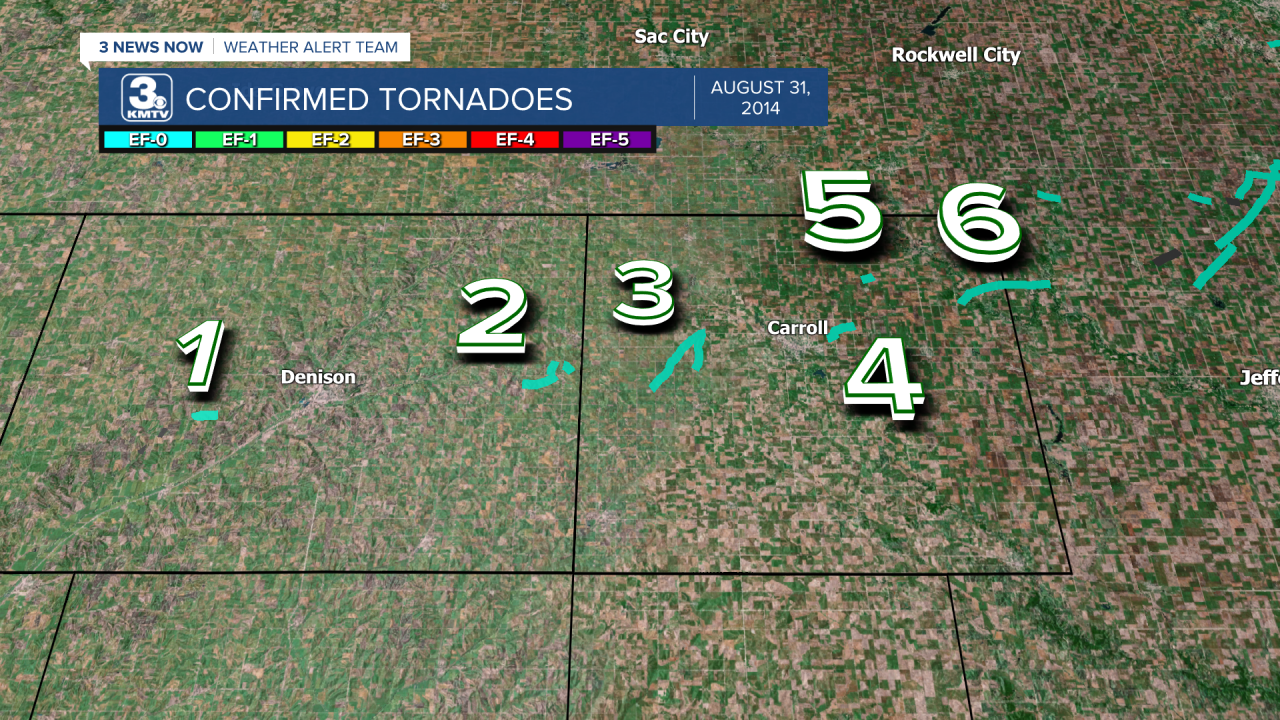
There is a third case that introduced this question to modern meteorologists, Aug. 31, 2014. As the meteorologist who researched the event said, "one of Iowa's largest tornado outbreaks that no one remembers". After December 15, 2021, it is Iowa's second largest tornado outbreak by tornado count with 34 confirmed tornadoes.
An event that on the surface seems somewhat benign, a line of storms crossing through central Iowa. Some wind damage near Denison and Carroll, and that was it. If it wasn't for an accidental discovery made the year after, this event would officially have two tornadoes. Now, it has at least 30, with the possibility of many more. In this installment of This Week in Weather History, the story of how one severe weather event exposed a potential major research point for meteorology down the road.
AUGUST 31, 2014: AS IT HAPPENED
The severe weather set-up for Aug. 31, 2014, was fairly typical for the late summer months. A cold front was moving across eastern Nebraska that afternoon. Ahead of the front, temperatures warmed into the low 80s across Iowa. A cluster of thunderstorms that moved across northern Iowa that morning had laid down an outflow boundary which was the focus for storm development that afternoon.

By mid-afternoon, storms began to develop across eastern Nebraska. Those storms produced some gusty winds and large hail, as well as heavy rainfall. Ahead of this developing line of storms, a single storm developed over Denison. This storm produced large hail before being absorbed into the main line of storms. That line became a bow echo or an intense line of damaging storms producing widespread gusty winds. Across Crawford and Carroll Counties, wind gusts approaching 70 mph did significant damage to trees and power lines. The bow echo continued off to the east where it produced more tree damage north of Des Moines, weakening as it approached eastern Iowa.

In the days after the storms, the National Weather Office in Des Moines did not receive any damage reports consistent with tornadoes, so no ground surveys of tornadoes were done originally. On Sept.10, a couple of forecasters went to Carroll County to asses some damage, where two tornadoes were confirmed. One of those occurred northeast of Glidden in Carroll County, the other was in Webster County in central Iowa.
FROM 2 TO 112 TORNADOES???
A year after the Aug. 31, 2014, event it was far from anyone's mind. It was not until meteorologist Kevin Skow, then an intern at the National Weather Service in Des Moines but today works at the NWS La Crosse, Wis. office, was looking at radar imagery of a different day when something caught his eye. He was looking in Crawford County when he noticed a strange mark on the background map of the radar software he was using. Curious, he did more investigating and realized it was likely corn damage due to a tornado. The question is, which day did it occur? After pondering, it clicked that it might have come from Aug. 31, 2014. Kevin had surveyed the two tornadoes on that day, so he was familiar with the day and the geographical location of where the storms were confirmed.
The reason why Kevin was able to locate this tornado track was an incredibly lucky coincidence. Every year, the USDA Farm Services Agency has something known as the National Agriculture Imagery Program (NAIP). The NAIP is a collection of high-resolution aerial images collected by planes with specialized cameras at 1-meter resolutions of less of the eastern US during peak agricultural season. Think of NAIP imagery as like Google Street View, but from a plane. Between Sept. 6 and Oct.15, the state of Iowa was captured using NAIP imagery. This meant that there were high-resolution aerial photographs of the entire state of Iowa in the immediate days after the Aug. 31 storms, meaning every single tornado or downburst of winds that did crop damage was captured in 1 meter or less resolution. This extraordinary circumstance is what allowed the following six months of Kevin Skow's life to be consumed.
Kevin and others spent the next half a year in 2015 scouring through the imagery, looking at every farm field for damage. By the end of the grueling search, the meteorologists were left speechless when they identified 112 total tracks of damage through corn fields.


Now, the question was were each of those 112 tracks tornadoes? If it was, it would completely shatter the record of tornadoes in a single day for not just Iowa, but propel it into the top five tornado outbreaks in U.S. history. To address this, Kevin and the other meteorologists made a classification system based on several criteria.


Using that classification system, of the 112 tracks identified: 35 were officially confirmed as tornadoes, 25 of the 112 were classified as "unknown", while 51 were of the "misovortex" category.

CRAWFORD/CARROLL COUNTY TORNADOES
Of the 35 tornadoes, ten of those occurred across Crawford and Carroll Counties in the KMTV viewing area. Most of these just produced crop damage, but in the case of the Glidden tornado, some tree damage was noted.
The following images are from the tornadoes in Crawford and Carroll Counties. Some of these tracks are difficult to see, so arrows are placed next to them to make them more visible. A tell for tornado damage in crops is the scar seen in the imagery, as clearly can be seen in many of these subsequent images.


QUESTIONS FROM 2014
After the discovery of these tornadoes, questions remained. Does every storm complex produce these excessive amounts of tornadoes, or was this a fluke? What does it mean for tornado warnings, if radar isn't the greatest at detecting these circulations? Should these tornadoes even be warned, as almost all of them remained in open fields and produced little structural damage, is it worth it?
During the event itself, the NWS only issued two tornado warnings, meaning around 98% of the tornadoes did not have tornado warnings, although the line had severe thunderstorm warnings. The main issue with attempting to tornado warn every single small circulation is the "cry wolf effect", where people begin to tune out frequent tornado warnings. So, is over-warning a safer option to catch every tornado, but run the risk of crying wolf? These are questions that the NWS is working on now, and answers continue to slowly reveal themselves as more of these events happen.
As for the tornadoes question. It is a probability that this event is on the extreme spectrum of how many tornadoes one storm can produce. However, it likely means that storms like this one are more capable of producing smaller tornadoes that sometimes go undetected. If it was not for Kevin's curiosity of a possible tornado on a radar map, or the NAIP gathering imagery in the weeks after the storm, it was likely this would have been missed entirely. The weather service now has more access to high-resolution satellite imagery than the NAIP, and it is used in events where tornadoes might have happened in hard-to-reach places. Case in point, the July 12 tornadoes in eastern Nebraska and western Iowa where nine tornadoes were confirmed, a few of those were confirmed using satellite imagery. (More info on NAIP imagery here)
As technology begins to improve, answers to these questions will become more apparent. We can thank one of the largest tornado outbreaks in Iowa history that no one knows about.
SOURCES/ACKNOWLEDGMENTS
A huge thank you to Kevin Skow for providing most of this information via an interview with him. For those who are interested more in this event, his paper on the topic is linked here.
Those interested in looking at the full path tracks can access the NAIP imagery here, just go to the image settings select the "2014 orthophotos" and zoom around.
